Losses of plant protection products to water: what is the best risk assessment method?
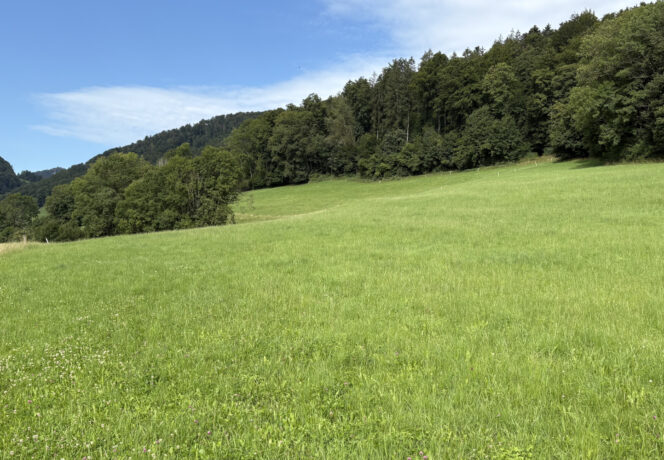
Photo: Office for Environmental Protection and Energy, BL, Konz N.
Final report on erosion risk models, October 2020, 1-53 (in German)
Run-off and erosion contribute to the pollution of water by plant protection products. Targeted measures to reduce this pollution require detailed field analysis. Existing methods have now been compared for the first time in order to assess their suitability.
Erosion and run-off from surfaces and drainage contribute significantly to the water pollution caused by agricultural plant protection products (PPP). The national action plan for the risk reduction and sustainable use of PPP (NAP PSM) therefore requires a farm-specific tool to be developed, which can be used to determine the potential risks of applying PPP on fields and to identify targeted risk reduction measures. The aim of this study was to evaluate existing risk forecasting models in terms of their requirements and validity.
Which evaluation methods were compared?
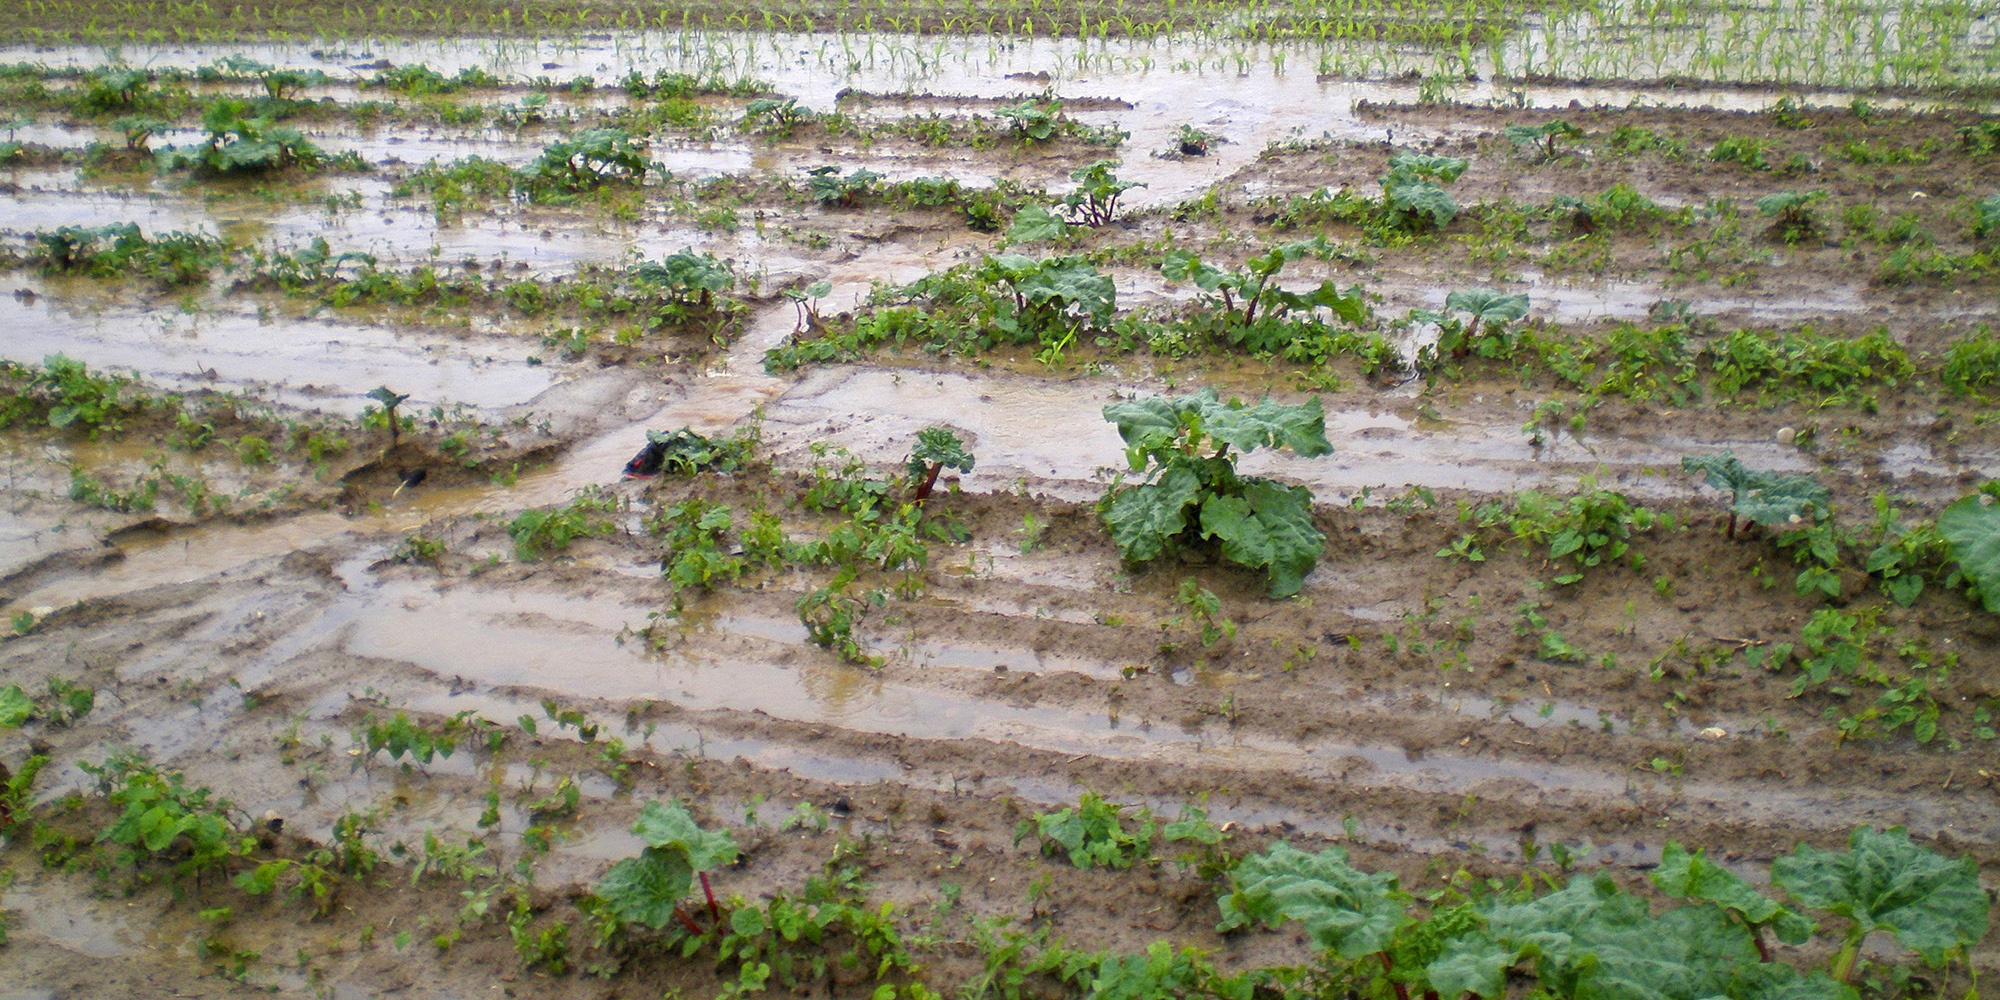
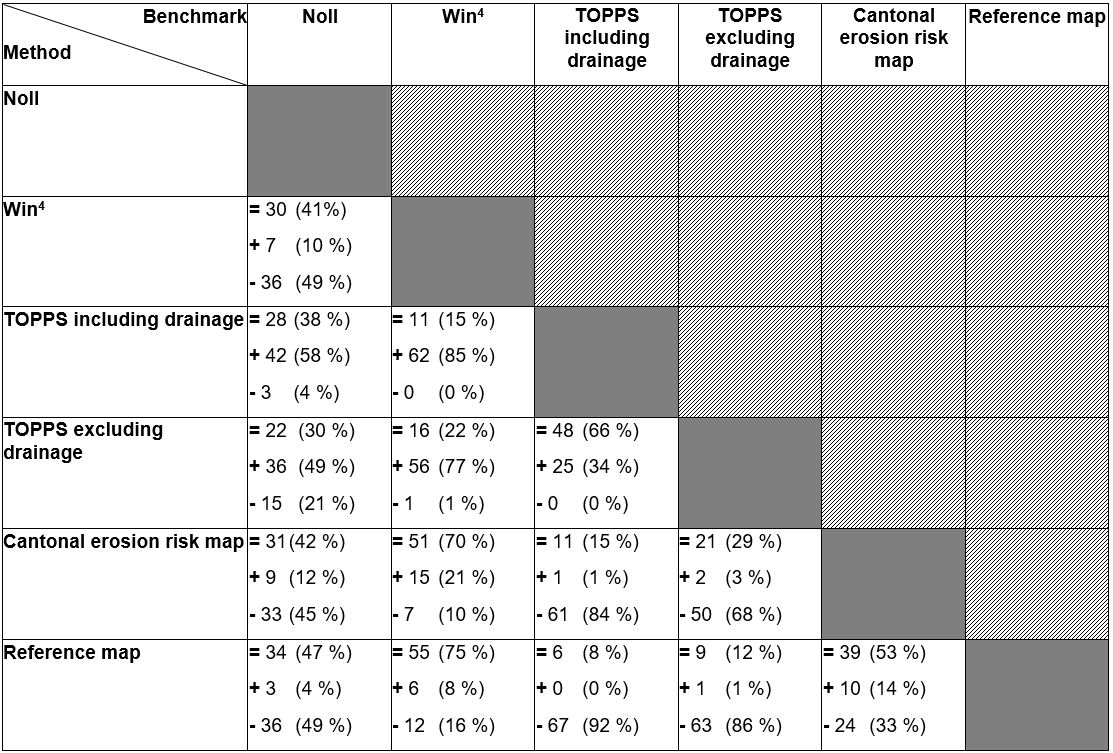
The Swiss models examined were the Win4 method, the Noll method and the ERK (erosion risk map) of the Canton of Basel-Landschaft. In addition, the European method according to TOPPS (Train Operators to Promote best management Practices & Sustainability) was used. A reference map based on annually conducted mapping (2014-2020) of actual erosion was used so that the risk forecasts could be compared to real conditions. The risks of erosion and run-off for specific areas of land and the computing time required for the various models were compared.
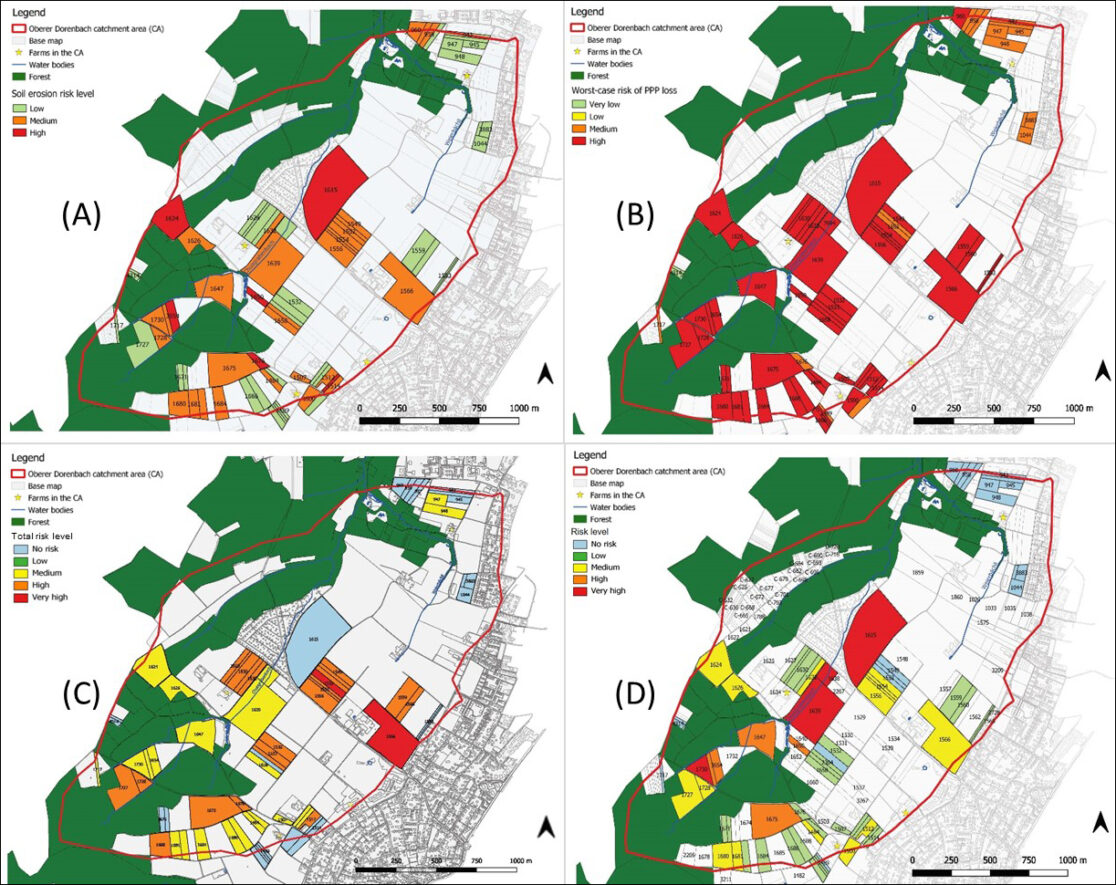
The comparison was modelled for a total of 73 plots comprising 107 hectares of agricultural land in the catchment area of the Ressourcenprojekt Leimental BL (Leimental BL resources project).
Risk forecasts are model-dependent
In a direct comparison, the risk forecasts of the various methods displayed differences, some of them major. This is evident not only from the risk classifications of the individual areas, but also the different resolution of the data used and the time spent.
The longest computing time for all the areas evaluated was required by the Win4 method at 100 hours, followed by the Noll method (60 hours) and TOPPS (40 hours). The shortest time required was the ERK method, at only 5 hours. The critical factors here, were whether the different methods considered areas with similar characteristics as single entities or as individual plots, and how many factors were taken into account. Another key point was whether the assessment depended solely on maps (ERK) or whether it included a field classification (Win4, Noll, TOPPS) and interviews with the farm manager (Win4).
The different weightings and resolution of individual factors also had a significant influence on the forecasts, for example topographical factors (relief, distance from water or drained roads, drainage shafts) and cultivation factors (crop rotation, tillage, direction of cultivation). In particular, the divergent assessment of drainage as a possible path for PPP to enter water had a pronounced influence on the various forecasts.
A complete picture of potential PPP losses to water could only be obtained and optimum reduction measures identified by integrating soil maps, drainage plans and crop log book data.
Conclusions
- In a direct comparison, the four methods studied resulted in different risk forecasts.
- The forecasting quality of the models applied depends heavily on their goals and framework conditions. This is reflected in the resources used in each case.
- None of the methods fulfils the requirements needed to develop a nationwide Swiss tool, as envisaged by the NAP PSM.
- The method-specific advantages and disadvantages have to be weighed up in terms of their efficiency and validity, and the characteristics of the individual methods need to be combined in a standardised, generalised evaluation matrix.
- The study serves as a critically important base for the Field Analysis section of the tool.
Bibliographical reference
Losses of plant protection products to water: what is the best risk assessment method?