Risk Indicators for Plant Protection Products: Further Analyses for Calculation
Photo: Carole Parodi,
Agroscope
Agroscope has developed risk indicators which show the development of risks associated with the use of plant protection productsfor important environmental compartments, describe the risk potential of the active substances and take account of legal measures for risk mitigation.
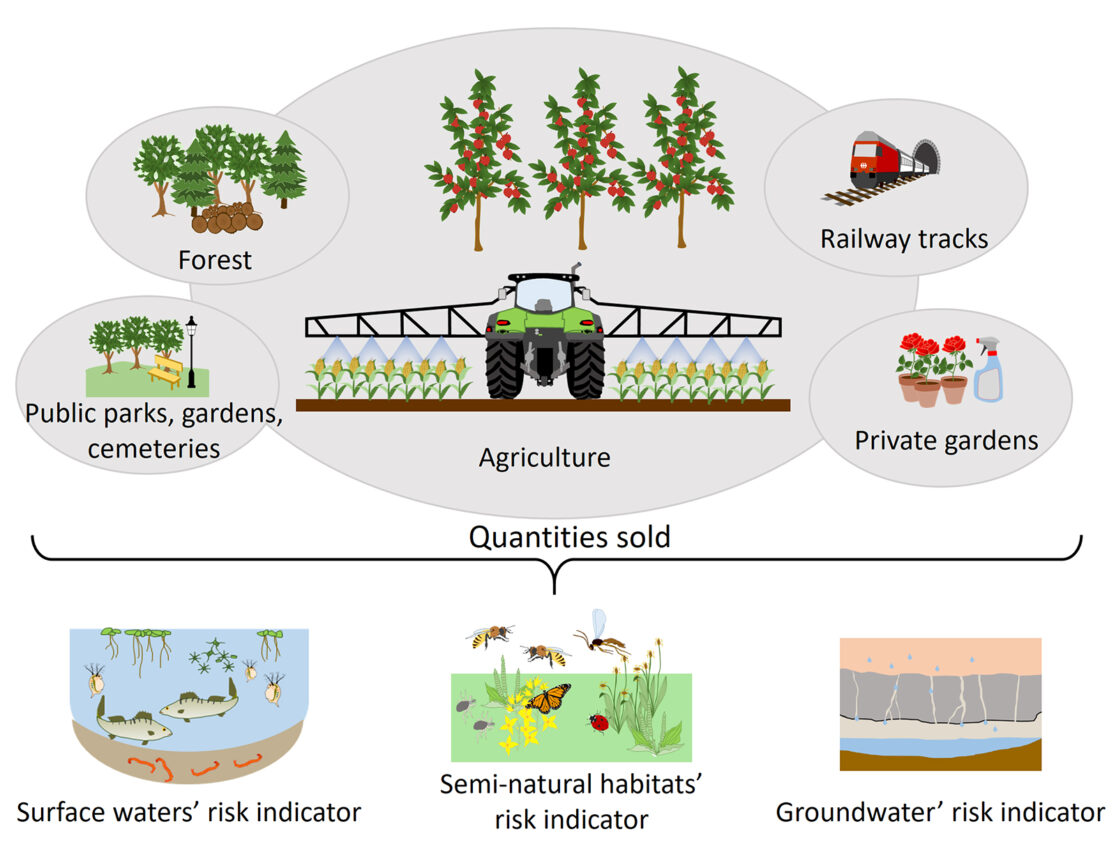
In 2021, in order to offset the potential environmental impacts of chemical plant protection, the Swiss Parliament passed the ‘Federal Law on the Reduction of Risks from the Use of Pesticides’, which came into force on 1 January 2023. Agroscope developed three risk indicators capable of depicting the development over time of the potential risk to organisms in surface waters and semi-natural habitats as well as the potential risk of groundwater pollution, based on the amounts of plant protection products (PPPs) sold annually (Fig.1).
This report explains how the indicator values were calculated and how measures for reducing PPP inputs into surface waters were taken into account. The impact of individual parameters and of risk-reduction measures on the indicator values are discussed. In addition, the findings from indicator calculations were compared with data from national monitoring programmes.
Total risk potential for groundwater from PPP metabolites declining since 2012
The indicator values are calculated as the sum of the individual risk potentials of all PPP active substances. The total risk potentials for ‘surface waters’ are largely determined by insecticides from the pyrethroid and organophosphate groups. In the 2012-2021 investigation period they exhibit a slight downward trend attributable to risk-reduction measures, in particular the construction of washing areas compliant with water-protection legislation as well as measures for controlling run-off and drift. Pyrethroids and organophosphates together with a few herbicides are likewise the main contributors to the total risk potential for ‘semi-natural habitats’. The indicator shows no clear trend over time for the period under review. The total risk potential for groundwater, on the other hand, is driven by the metabolites of a limited number of herbicides and fungicides. The development over time of the ‘groundwater’ risk indicator shows that the target of reducing the total risk potential by 50% with respect to 2012-2015 has already been achieved.
Further analyses confirm the major impact of certain active substances on the total risk potentials
To conduct a plausibility check on the calculated indicators and to test their robustness, the influence of various assumptions and the choice of parameters on the indicator values and their relative progression over time were tested. It was shown that the use of additional ecotoxicological data or alternative ecotoxicological reference values does not substantially influence the development over time of the total risk potentials for ‘surface waters’ and ‘semi-natural habitats’. Nor did varying a number of parameters affecting the efficacy of risk-reduction measures (‘surface water’ risk indicator) or omitting metabolites for which standard values alone rather than experimentally determined substance properties were available (‘groundwater’ indicator) have any noteworthy effect on the development over time of the relevant risk indicators.
Monitoring data largely agree with the calculated indicator values
Unlike risk indicators, which highly aggregate risk potentials, (national, annual) monitoring data reflect the actual environmental concentrations of a PPP at specific sites and at given points in time. A direct comparison between indicator values and monitoring data is therefore not appropriate. However, data from the ‘National Surface Water Quality Monitoring Programme’ (NAWA) also repeatedly show that insecticides from the pyrethroid and organophosphate groups contribute substantially to the overall risk in the waters studied. Monitoring data from the ‘National Groundwater Monitoring’ measurement programme (NAQUA) also match well with the indicator values of the ‘groundwater’ risk indicator, since frequently detected metabolites also have a high rating in the risk indicator in terms of their risk potential. Since groundwater renewal often takes years if not decades, however, the decrease in risk potential will only gradually become apparent in the measured concentrations.
Conclusions
- The risk indicators allow us to examine changes over time in the total risk potentials for ‘surface waters’, ‘semi-natural habitats’ and ‘groundwater’, based on the amount of PPPs sold annually throughout the whole of Switzerland.
- The risk indicators are a measure of the total risk potential based on all PPP active substances sold annually at a national level.
- The risk indicators provide information on which active substances contribute the most to the total risk potential. Legal measures are also taken into account, allowing the impact of new risk-reduction measures to be modelled.
- The risk indicators are therefore an important tool for monitoring the achievement of the risk-reduction target set out in the legislation.
Bibliographical reference
Risk Indicators for Plant Protection Products: Further Analyses for Calculation